Marketing Attribution Models Explained
Seven attribution models applied to one $1,000 sale, with the arithmetic, a which-model-for-which-question table, and what each model cannot see.
- Author
- SourceTrack Team
- Category
- Attribution & Analytics
- Read Time
- 05 Mins read
- Published Date
Inside the page
- How do the seven models split one sale?
- Where do the time decay numbers come from?
- What do U-shaped and W-shaped actually do?
- What is data-driven attribution, and why is it not in the table?
- Which model should you use for which question?
- What can no model see?
- Running several models on the same data
- Frequently asked questions
- Which attribution model is the most accurate?
- Is last touch attribution wrong?
- How many conversions do I need for data-driven attribution?
- Can I change my attribution model later?
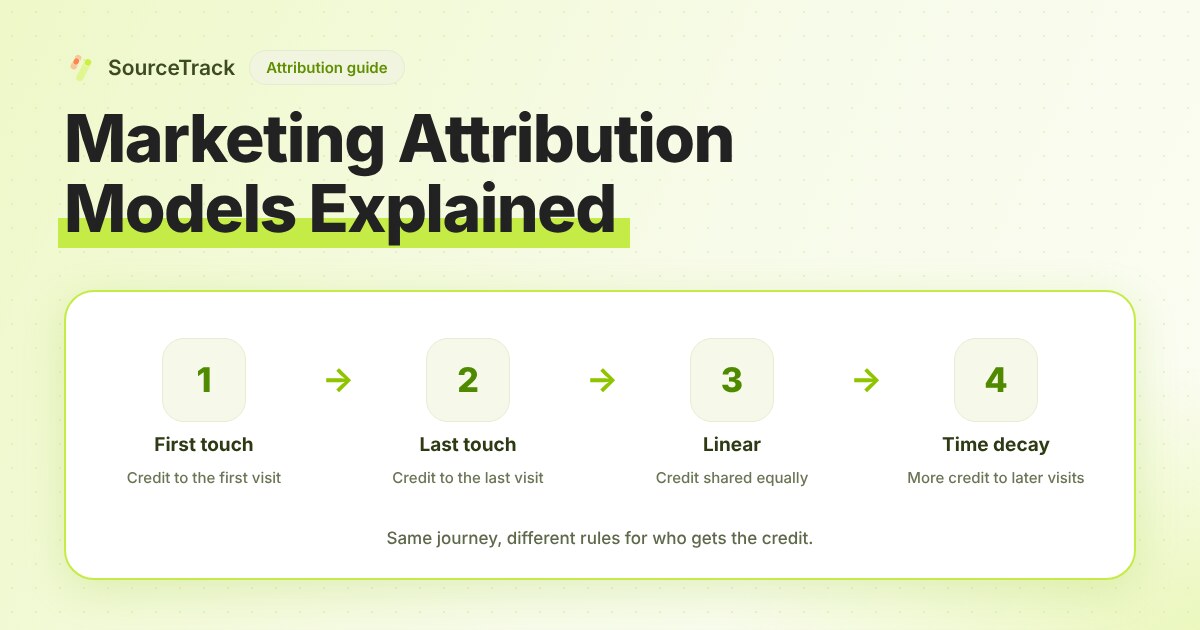
An attribution model is a rule that decides how much credit each marketing touch gets for a sale. Seven rules are in common use: first touch, last touch, linear, time decay, position-based (U-shaped), W-shaped and data-driven. They give different answers on the same sale, and none is the truth. Choose by the question you are asking, then check your pick against one other model.
How do the seven models split one sale?
Take one illustrative $1,000 sale. The buyer touched you four times, in this order:
- A paid search click, 14 days before the sale.
- An organic search visit, 9 days before.
- An email click, 3 days before. This visit is where they filled in the form and became a lead.
- A direct visit, on the day of the sale. This visit created the deal.
Here is how each fixed-rule model splits the $1,000:
| Model | Paid search | Organic | Direct | |
|---|---|---|---|---|
| First touch | $1,000 | $0 | $0 | $0 |
| Last touch | $0 | $0 | $0 | $1,000 |
| Linear | $250 | $250 | $250 | $250 |
| Time decay (7-day half-life) | $104.03 | $170.68 | $309.17 | $416.12 |
| Position-based, 40/20/40 | $400 | $100 | $100 | $400 |
| W-shaped, 30/30/30/10 | $300 | $100 | $300 | $300 |
The same four touches make paid search worth anywhere from $0 to $1,000. That spread is the reason to know which model you are reading.
Where do the time decay numbers come from?
Time decay gives recent touches more credit. You choose a half-life: a touch that happened one half-life earlier gets half the weight. HubSpot’s attribution documentation states a 7-day half-life for its time decay model, so we use 7 days here. The weight of a touch is 2 raised to the power of minus its age in days divided by 7.
- Paid search, 14 days old: 2^(-14/7) = 0.250
- Organic, 9 days old: 2^(-9/7) = 0.410
- Email, 3 days old: 2^(-3/7) = 0.743
- Direct, 0 days old: 2^0 = 1.000
The weights add up to 2.403. Each touch’s credit is its weight divided by 2.403, times $1,000. Paid search gets 0.250 / 2.403 = 10.4%, which is $104.03. Direct gets 1.000 / 2.403 = 41.6%, which is $416.12. A shorter half-life pushes more credit to the last touch. A longer one moves the result toward linear.
What do U-shaped and W-shaped actually do?
Position-based, also called U-shaped, puts 40% on the first touch, 40% on the last, and splits the remaining 20% across the middle. HubSpot’s documentation uses the same 40/20 shape, but applies the second 40% to the touch that converted the visitor into a lead. In our example we treat the last touch as the closer, so the middle two touches share $200: $100 each.
W-shaped adds a third milestone. In HubSpot’s definition, the first touch, the touch that created the contact and the touch that created the deal get 30% each, and the other touches share the final 10%. In our example that gives paid search $300, email $300, direct $300, and organic the $100 left over.
W-shaped needs a CRM that records when a lead and a deal were created. Without those two timestamps, you cannot place the milestones, and the model reduces to U-shaped.
What is data-driven attribution, and why is it not in the table?
Data-driven attribution fits a statistical model to the paths of people who converted and people who did not. Google describes GA4’s data-driven model as using machine learning to compare those paths and estimate how much each touchpoint raises the chance of a key event. You cannot compute it by hand from one journey, so it has no row above.
Two things to know. It needs a lot of paths to learn from, and the tool that builds the model decides how many. And it is only as good as the touches it can see. If offline touches are missing, the model learns from an incomplete picture.
One more fact about the platforms. According to Google’s GA4 help and Google Ads help, first click, linear, time decay and position-based are no longer available in either product. GA4 keeps data-driven and two last-click variants, and Google Ads keeps data-driven and last click. If you want the other models on Google traffic, you need to apply them in a tool that stores the full journey.
Which model should you use for which question?
| Your question | Use | Why |
|---|---|---|
| Which channel starts journeys? | First touch | It credits only the entry point. |
| What closed this sale? Which retargeting ad or email? | Last touch | It credits only the final step. |
| Is a channel in the path at all, even if it never closes? | Linear | Every touch counts the same, so nothing disappears. |
| You sell on a short cycle and recent activity matters most | Time decay | Credit follows recency. Choose the half-life to match your cycle. |
| You care about both the entry and the close | Position-based | 80% of credit lands on the two ends. |
| You have a CRM with lead and deal dates and a long sales cycle | W-shaped | It rewards the milestones your sales team recognises. |
| You have a lot of tracked conversions and want weights learned from data | Data-driven | It replaces your guess with a fitted model, with the caveats above. |
Decision rule: if two models disagree on where to put your next dollar, do not move the budget yet. Find out why they disagree by looking at the journeys, and test the change on a small share of spend first. The attribution model calculator lets you try your own touches under each rule.
What can no model see?
A model only splits credit among touches that were recorded. It cannot fix a missing touch.
- Offline touches. A phone call, a trade show or a referral from a friend never enters the journey unless someone records it.
- View-through. If a person saw an ad and did not click, a click-based tracker has no event to credit.
- Cross-device. A phone visit and a later laptop purchase look like two people unless something links them, such as a login or a form submission.
- Cause and effect. Credit shows who was present, not who made the sale happen. A touch may have been present because the buyer was already on the way. Only an experiment, such as a holdout test, speaks to cause.
This is why a model is a lens on the same data and not the truth. Switching lenses changes the story you tell. It does not change what happened.
Running several models on the same data
SourceTrack offers ten attribution models, switchable on stored journeys with no re-tagging. That makes the comparison above something you can do on your own sales: change the model, look at the same journeys again, and see which channels hold up under every lens. The pricing page lists what each plan includes. If you are still setting up your tags, start with how to track UTM parameters. To see how the journeys behind these models are recorded, and where they break, read what multi-touch attribution is and how it works.
Frequently asked questions
Which attribution model is the most accurate?
None of them. Each model is a rule for splitting credit, and none of them measures cause and effect. Pick the model that fits the question you are asking, and compare it with one other model before you move budget.
Is last touch attribution wrong?
No. It is the right lens for questions about what closed a sale, such as which email or retargeting ad gets the final click. It is the wrong lens for judging channels that start journeys, because it gives them nothing.
How many conversions do I need for data-driven attribution?
It depends on the tool that builds the model, so check that tool’s documentation. If you have few conversions, a fixed-rule model such as linear or position-based is easier to explain and easier to check by hand.
Can I change my attribution model later?
Yes, if your tool keeps the full journey of each visitor and applies the model when you read the report. If the model is fixed at tracking time, the old data stays in the old model.
Related Blogs

How to Track ChatGPT and AI Referrals That GA4 Cannot Tie to Revenue
Classify visits from ChatGPT, Claude, Gemini and Perplexity, tie them to leads and revenue, and know what no tool can see.
SourceTrack Team
Attribution & Growth Engineering
28 Jul, 2026
Click IDs Explained: gclid, fbclid, msclkid and More
What gclid, fbclid, msclkid, ttclid and li_fat_id are, who adds them, what drops them, and how to check you still have one at conversion time.
SourceTrack Team
Attribution & Growth Engineering
20 Oct, 2026
Closed-Loop Attribution Explained
Closed-loop attribution links an ad click to a lead, a CRM stage and revenue, then sends that back to the ad platform. See where it breaks and how to test it.
SourceTrack Team
Attribution & Growth Engineering
20 Oct, 2026